I collaborated with Variable studio and Squint Opera to build online interactive application showing the next 50 years of London development.
This interactive data visualization includes changes in population, expansion in transportation, energy, education and many other factors that will impact the city growth and change.

We created map-based tool which allows stakeholders to explore the city growth and change, using data collected by Greater London Authority (GLA). The tool consists of four main parts: interactive map, timeline, filters, and additional data visualizations. The map was built with esri API, and shows the most important information for the users. It also allows them to filter by borough, or hand-drawn polygon.

Timeline shows the time spans of scheduled projects, and allows to filter years which are interesting to the users, upon selection, map and other filters change.

Filters on the right side show the most important information for current view, and adapt to data shown on map.

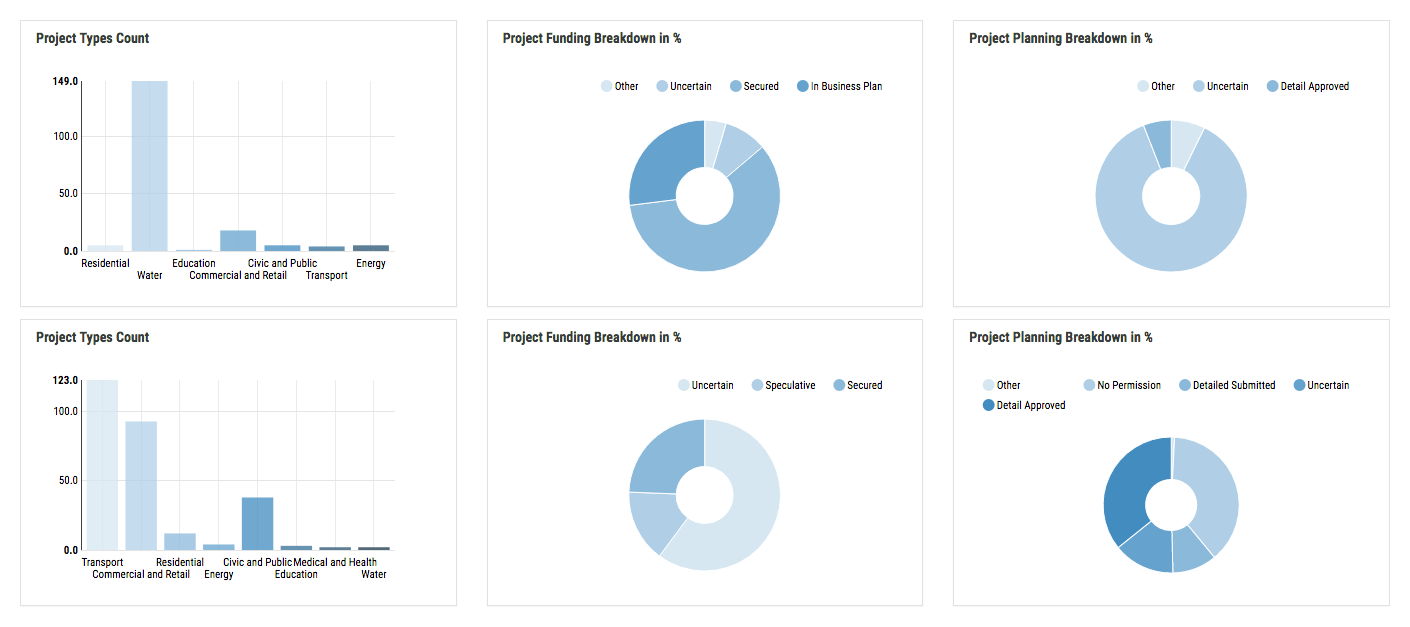
Data visualizations on the bottom extend user information on selected view, giving them more context.
This tool is extremely interactive, a change in one filter or selection propagates through the whole application, allowing users to drill down and select the most interesting context for them. It was built with React, Redux, esri map API, and D3.
You can play with the live version of the application here: http://maps.london.gov.uk/ima/