Livebook is an interactive notebook for Elixir, enabling everything from exploratory coding, through visualizing data, to building production applications. It's also multiplayer, can be self-hosted, backed by actual files on your hard-drive (a superset of Markdown) — definitely worth checking out!
I collaborated with José on a set of research prototypes that show a direction towards expanding Livebook with additional live-coding concepts: probing, tracing, and live test feedback.
None of these ideas are necessarily "new", but then again, what is. For prior art, make sure to check out:
- Usable Live Programming
- Example-Based Live Programming for Everyone
- Babylonian-style Programming
- Projection Boxes
- Margin Notes
Finally, some of the ideas were prototyped in JavaScript and not Elixir, mainly to optimize for research velocity (as in, I'm just faster in that world); there's nothing conceptually stopping these ideas from being applied to Elixir, and some of the prototypes are already being implemented in Livebook which is exciting to see!
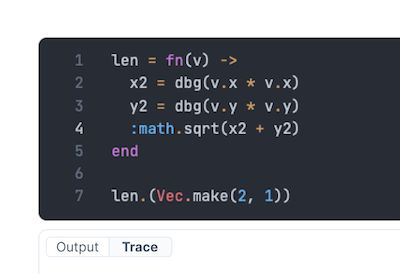
Elixir already has a concept of a dbg() which logs the value out, and passes it through (which already is an improvement over something like print() that requires restructuring your code around it).
Since we have control over both the editing environment and the runtime, we can easily extend the editor with live value display:

A couple of things to notice in the screenshot above:
- adding
dbg()calls doesn't change any logic about your program, and can be injected anywhere without having to restructure anything - we support inline logging not only for plain values, but also objects and arrays — these can grow huge, so we truncate them after a couple of characters, and you can always get to full view by hovering over them (both with mouse and a cursor)
- having this sort of always-on visualizations of relevant parts of the code makes it very easy to spot issues — it's easy to see that I forgot to
rest.join()to get back to a string from an array of letters
Probing described above provides a view into a static "snapshot" of the execution — notice how the dbg() inside map callback only logs out l and we don't see the e from the first loop.
Tracing is a way to display probed values over time and see the history of their execution.
Here's an example trace output from processing an array of todos and grouping them by attached tag:

To condense the view, but still keep the system generic, we're displaying "semantic miniatures" of the values.
Basic plain values can be easily displayed inline, but complex ones (like objects and arrays), are condensed to display how much they have changed between successive calls — for example +2 ~1 -0 means that two new fields have been added, one was modified, and none were removed.
Custom data types can be also provided by the users of the system, building up on the Kino system for defining interactive widgets, already used widely in Livebook.
The programmer can construct a more detailed ad-hoc view by clicking on these values to toggle their full display on/off:
Tracing could be implemented within Livebook as an additional output tab below a cell:

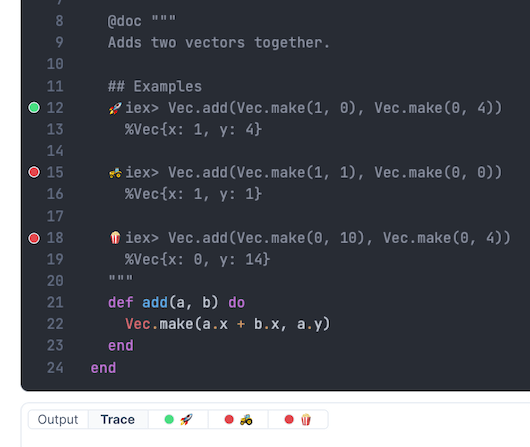
Elixir provides a way to inline tests inside the documentation strings: doctests. This feature is widely used by both Elixir core and libraries, and Livebook also has basic support for handling them.
As a part of this research project, we explored augmenting them more with live status updates, and integration with the probing and tracing described above.

Each test is enhanced with a traffic light-like status and a random emoji, which acts as an identifier. The tabs below a cell, in addition to output and main trace, also include tracing-per-test, so the programmer can focus on a specific issue one at-a-time.
Finally, even though it might be obvious, it's important to mention how much better probing and tracing mechanisms work, when they evaluate on every keystroke, compared to being an action you have to take explicitly.
As a programmer, I can stay at my keyboard and just type, and get inline live feedback of how my code behaves. If something is not quite right, it's easy to "wiggle" some structures/values, and see the rest of the code respond ("wobble"), I believe that this is crucial for building such a system that feels good!
This is something that was also an important realization in the Programmable Ink research at Ink&Switch, I think best verbalized here — immediate feedback makes it feel as if you are directly Working With The Material, helps build intuition and leverages Peripheral Vision for spotting patterns and issues.
- Live Coding Livebook — an exploratory work into enhancing Elixir's Livebook with probing, tracing, and live test feedback
- explicitly through some form of tracing/probing - like explored for example in the Live Coding Livebook research, and many other places